


Therma
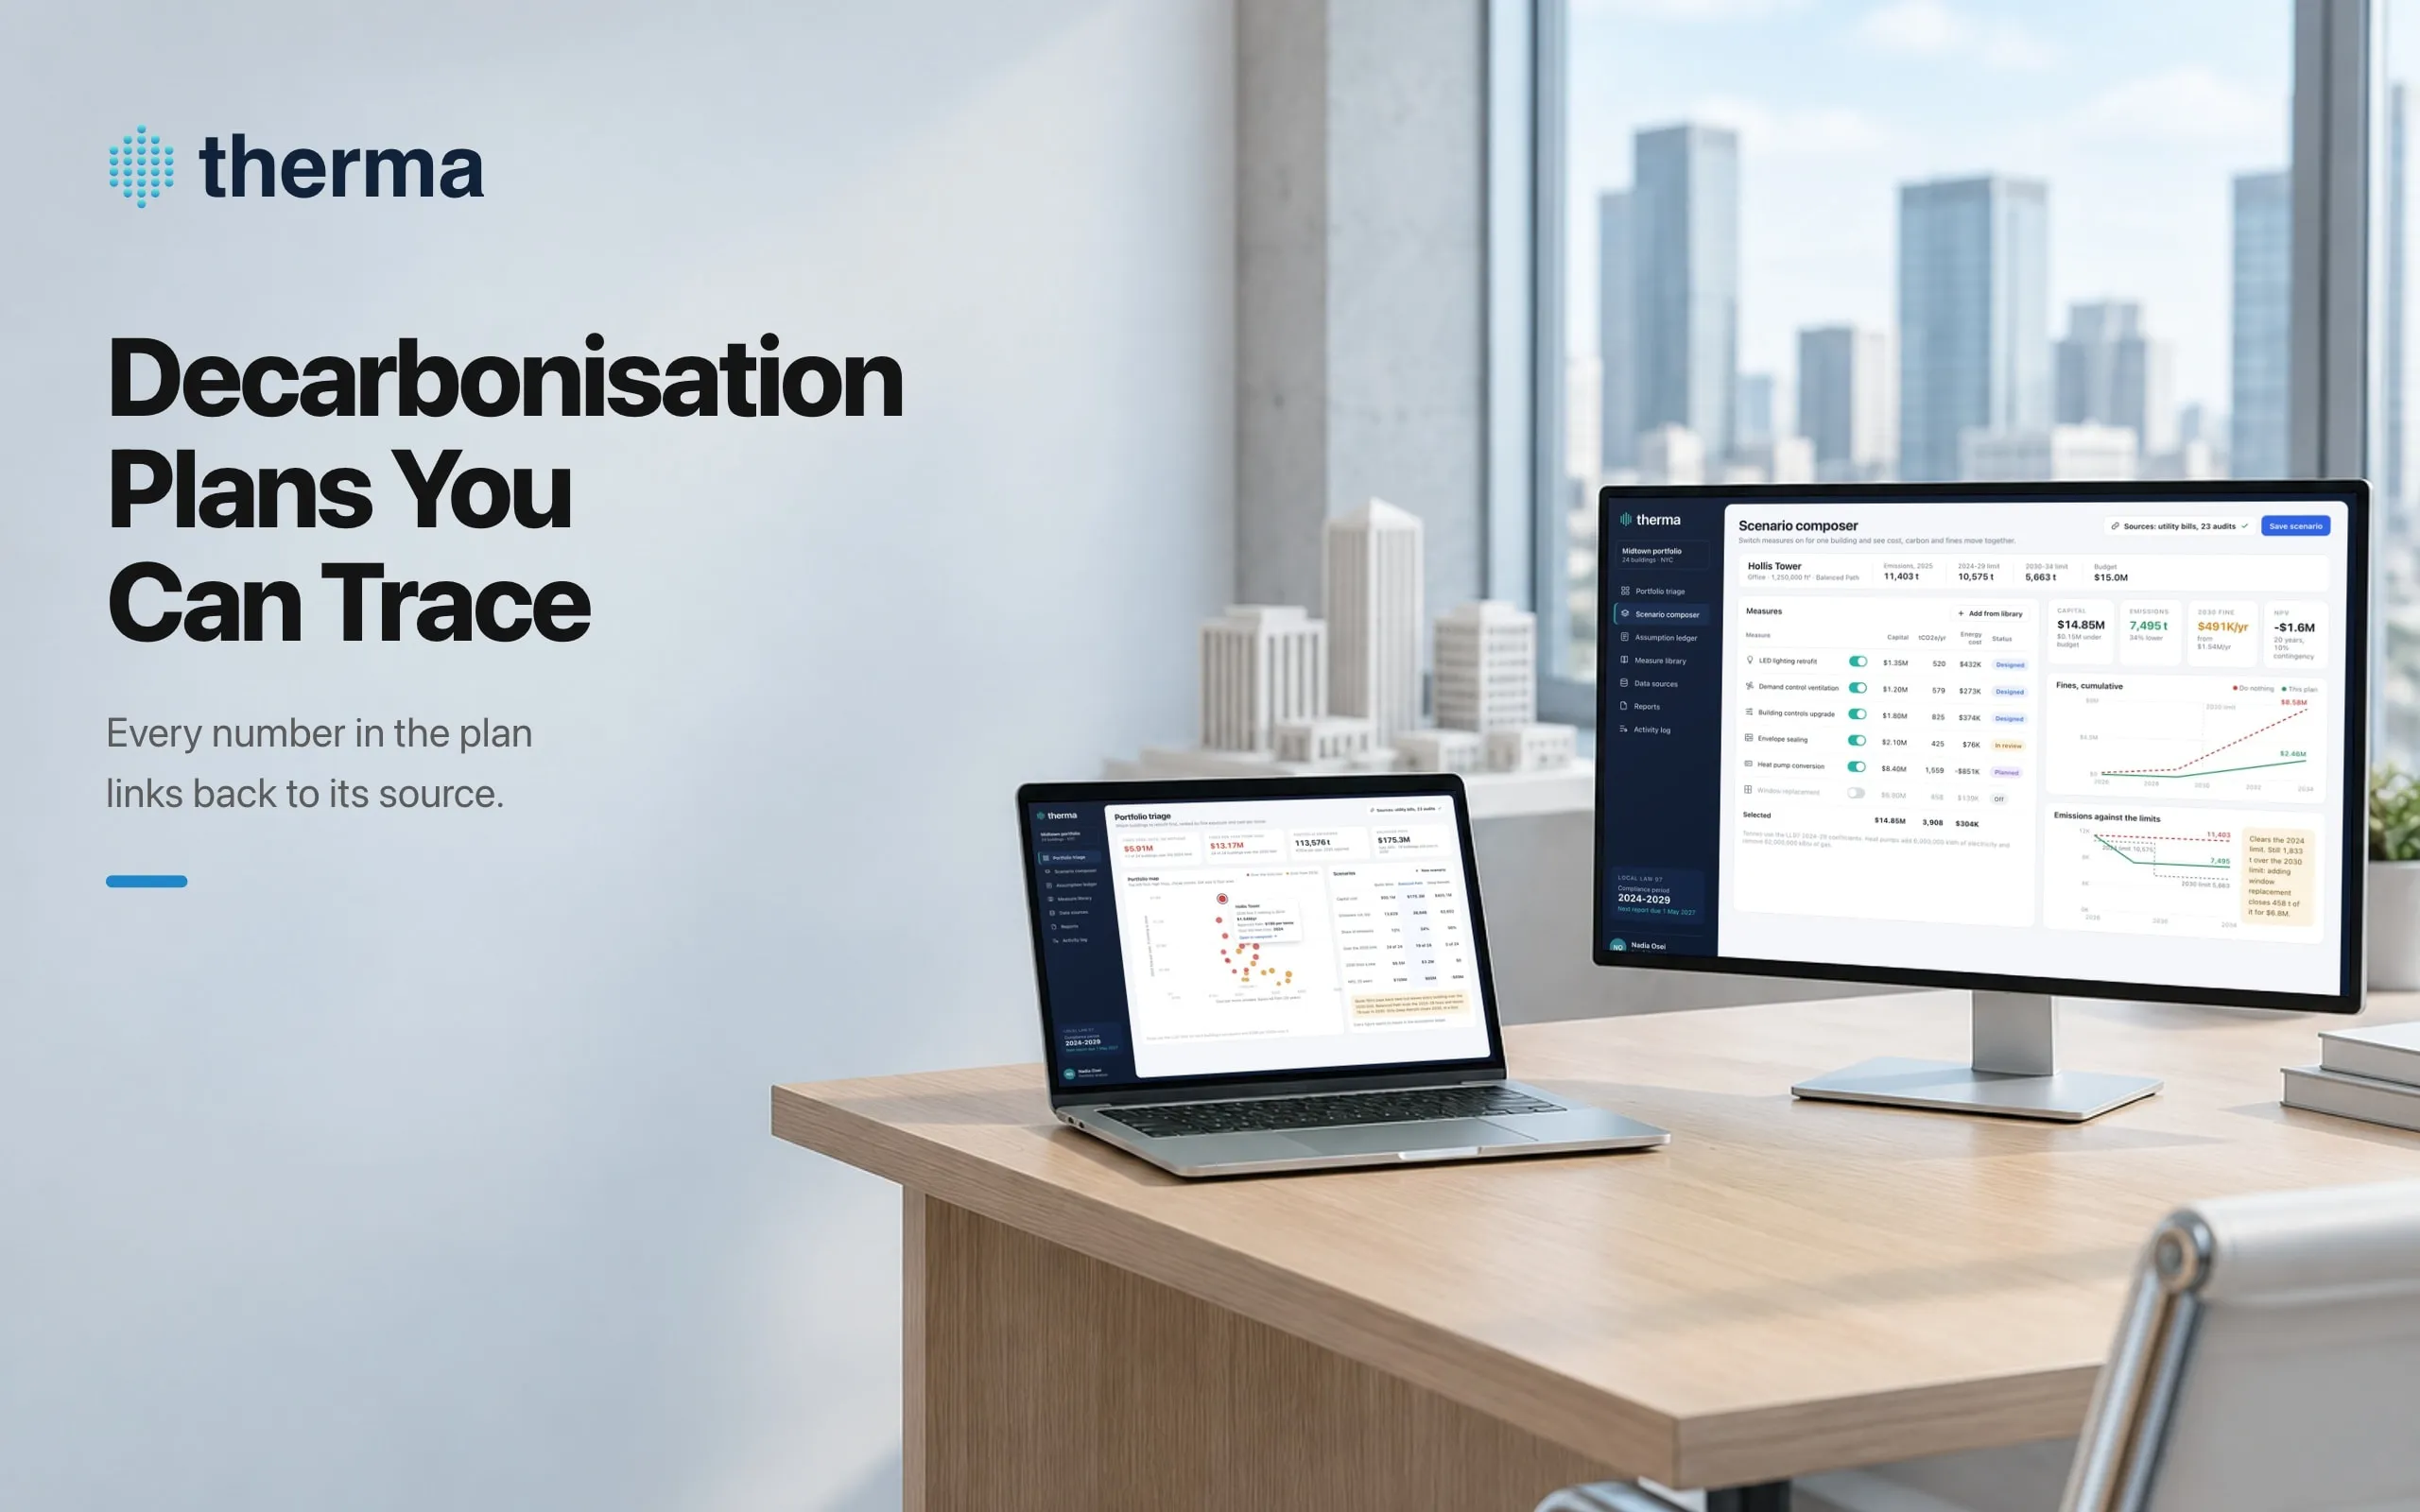
Decarbonisation plans for building portfolios where every number can be traced to its source.
- Platforms
- Web app
- Scope
- Product design
The situation
New York’s Local Law 97 caps the emissions of large buildings. Every tonne over the limit costs $268 a year, and the limits drop sharply in 2030. An owner of a building portfolio has to decide which buildings to retrofit, with which measures, and in what order.
The inputs exist: utility bills, engineering audits, the law’s own coefficients and limits. They arrive in different formats with different assumptions, so retrofit options rarely compare like for like and the capital decision stalls.
Therma puts them into one model where every figure can be traced back to where it came from.
The system behind it
- Data
- Buildings with floor area and occupancy, reported emissions, utility bills, audits, retrofit measures with costs and savings, energy prices, and the law’s coefficients and limits.
- Rules
- Each building’s limit depends on its occupancy and floor area, and drops in 2030. Fines are $268 per tonne over the limit. A measure’s value depends on the building it is applied to and the assumptions behind it.
- People
- Portfolio analysts who build the plan, engineers who supply the audits, and the executives who approve the capital and question the numbers.
Decisions
Start from the fine, not the spreadsheet
What brokeA list of 24 buildings sorted by emissions says nothing about which one to fix first.
What I decidedThe portfolio map plots each building by the fine it faces in 2030 against the cost of each tonne a retrofit would avoid, coloured by whether it is over the limit now or only from 2030. The ones to fix first sit top left. Scenarios sit beside the map in the same rows: capital, tonnes cut, buildings still over the 2030 limit, fines and NPV.
The trade-offTwo axes leave out timing and cash. A cheap tonne in a building with a boiler replaced last year is not cheap, so the map starts the argument but doesn’t end it.
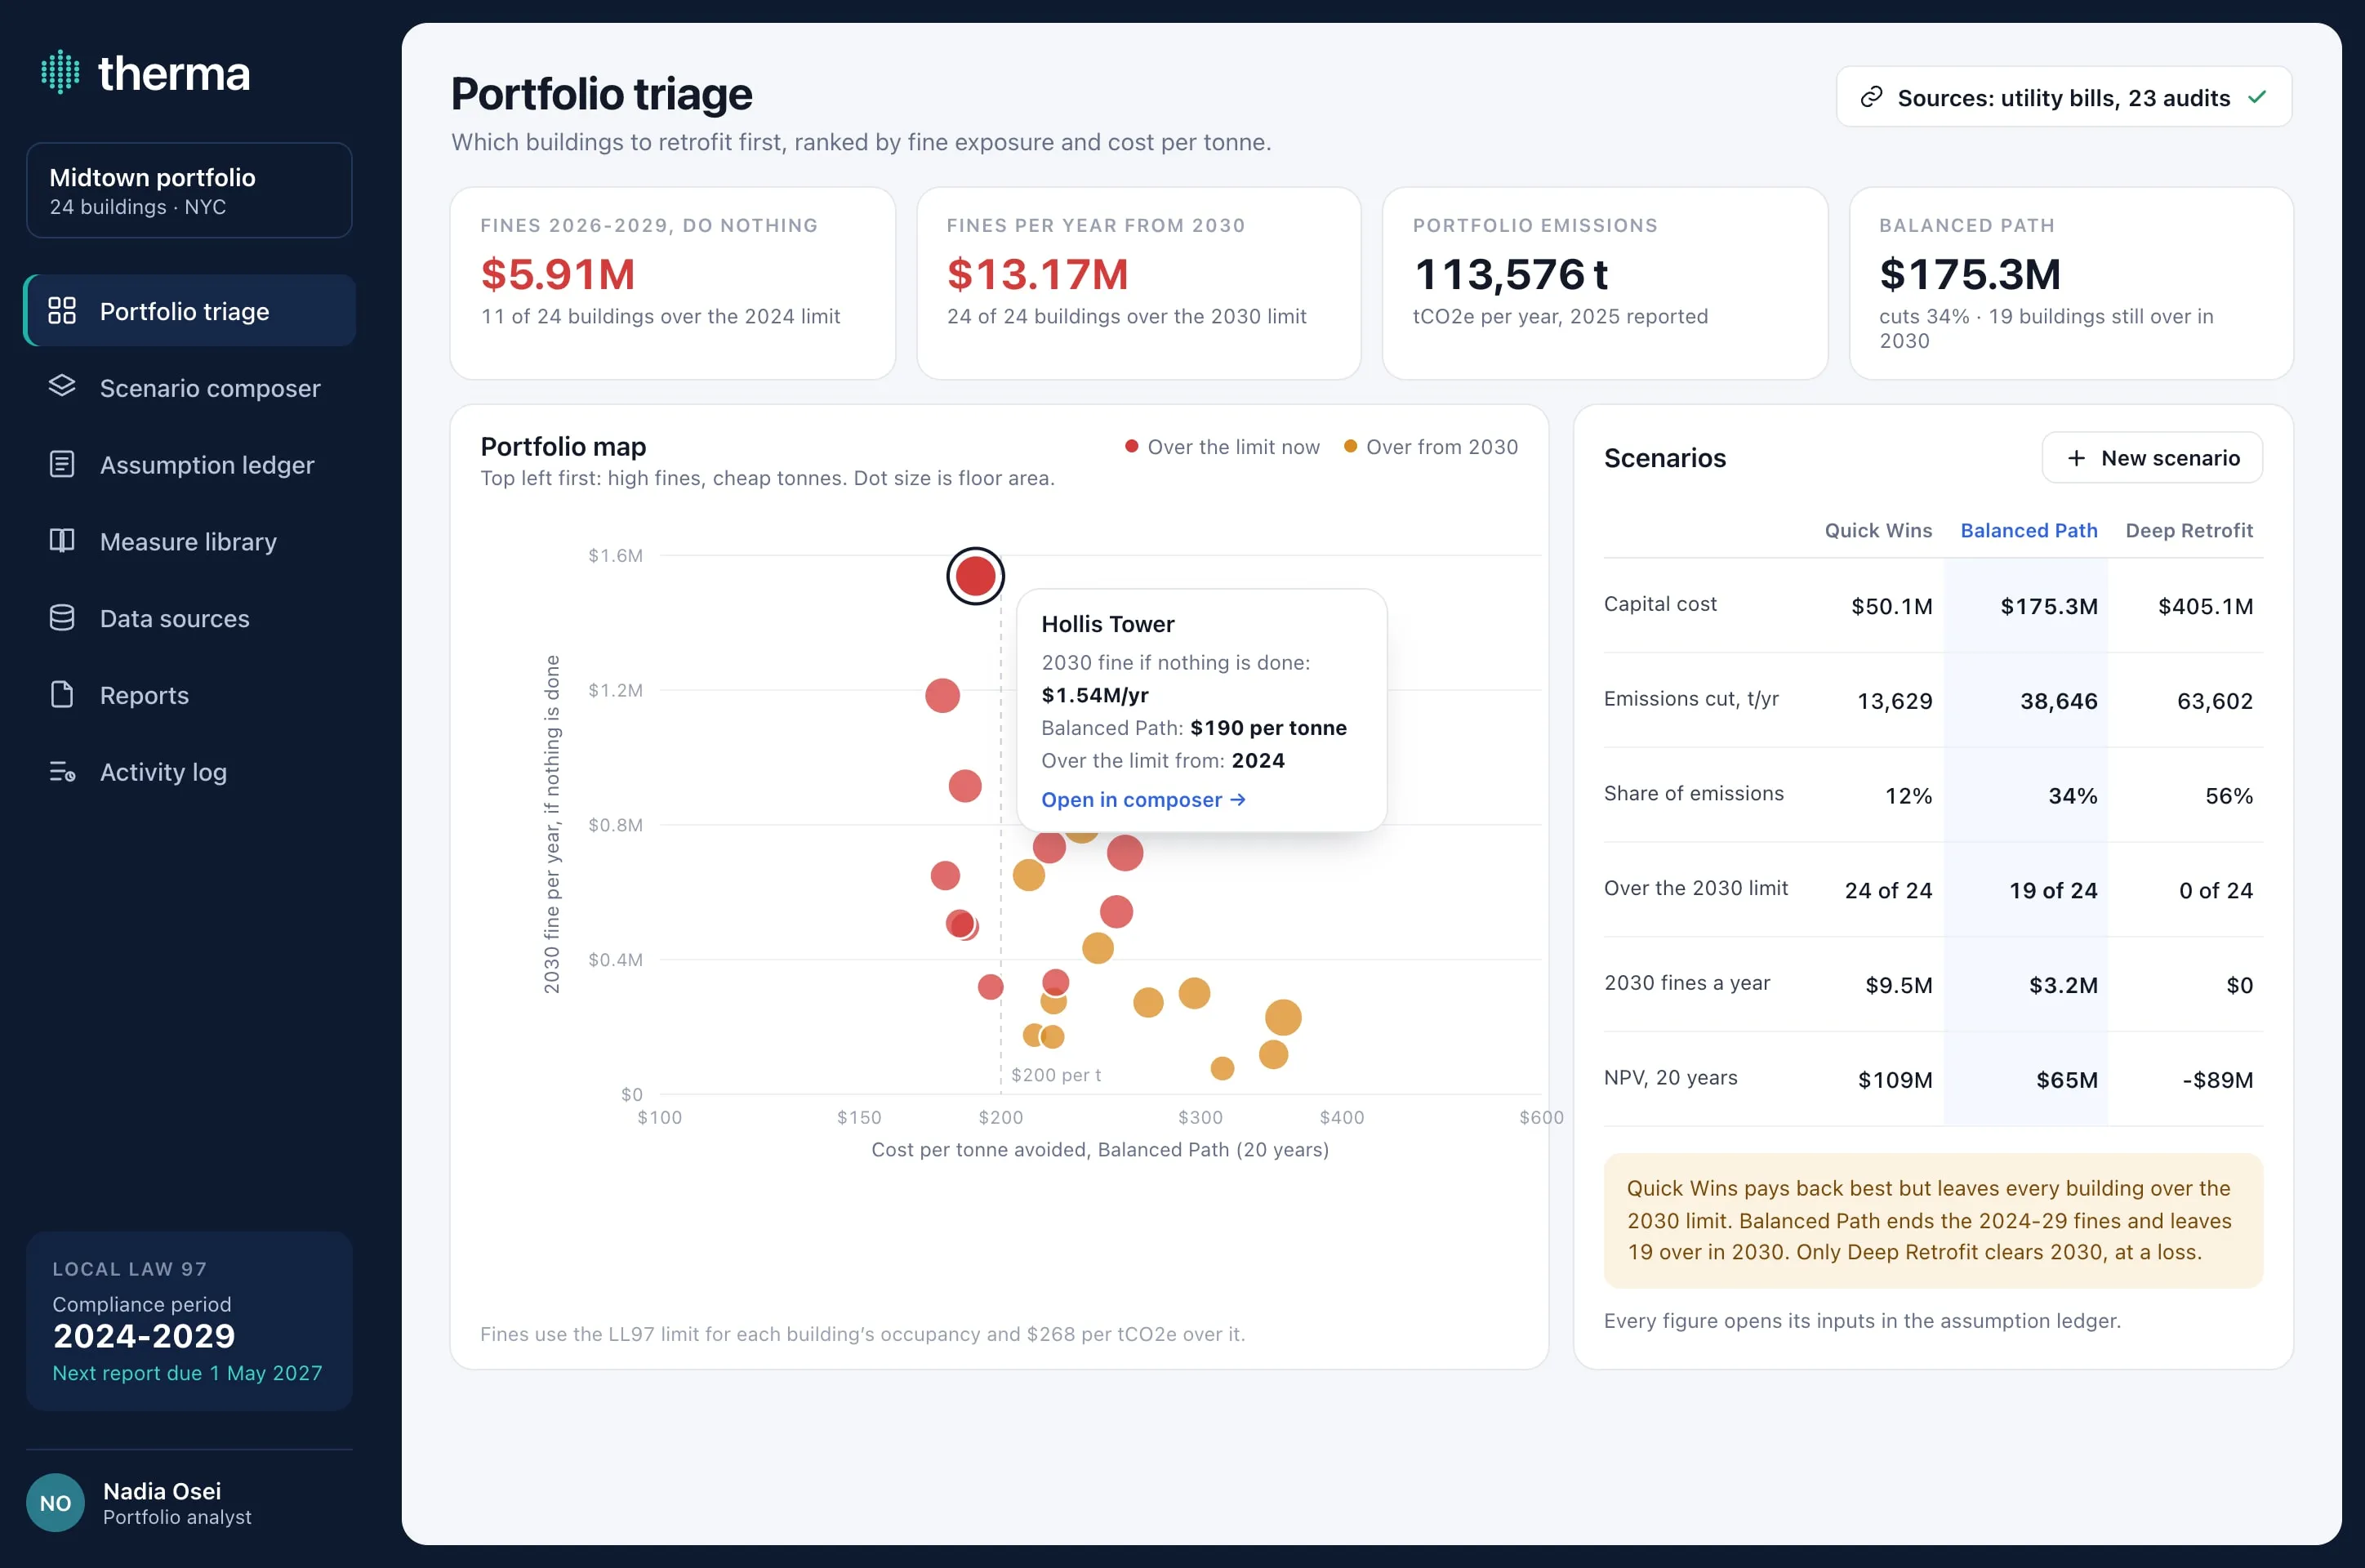
Quick Wins pays back best and leaves every building over the 2030 limit. Only Deep Retrofit clears it, at a loss. People trust numbers they can argue with
What brokeA projected fine or payback that nobody can trace gets challenged, and the plan loses the room.
What I decidedThe assumption ledger lists every input with its value, its source and its status. Values set by law, like the $268 fine and the grid coefficient, are locked. Defaults and estimates can be changed, and a pending change shows its effect on every scenario before it is saved. Each change is logged with who made it and why.
The trade-offEditable assumptions can be tuned until a plan looks good. The change history and its required reason are the brake, which only works if someone reads it.
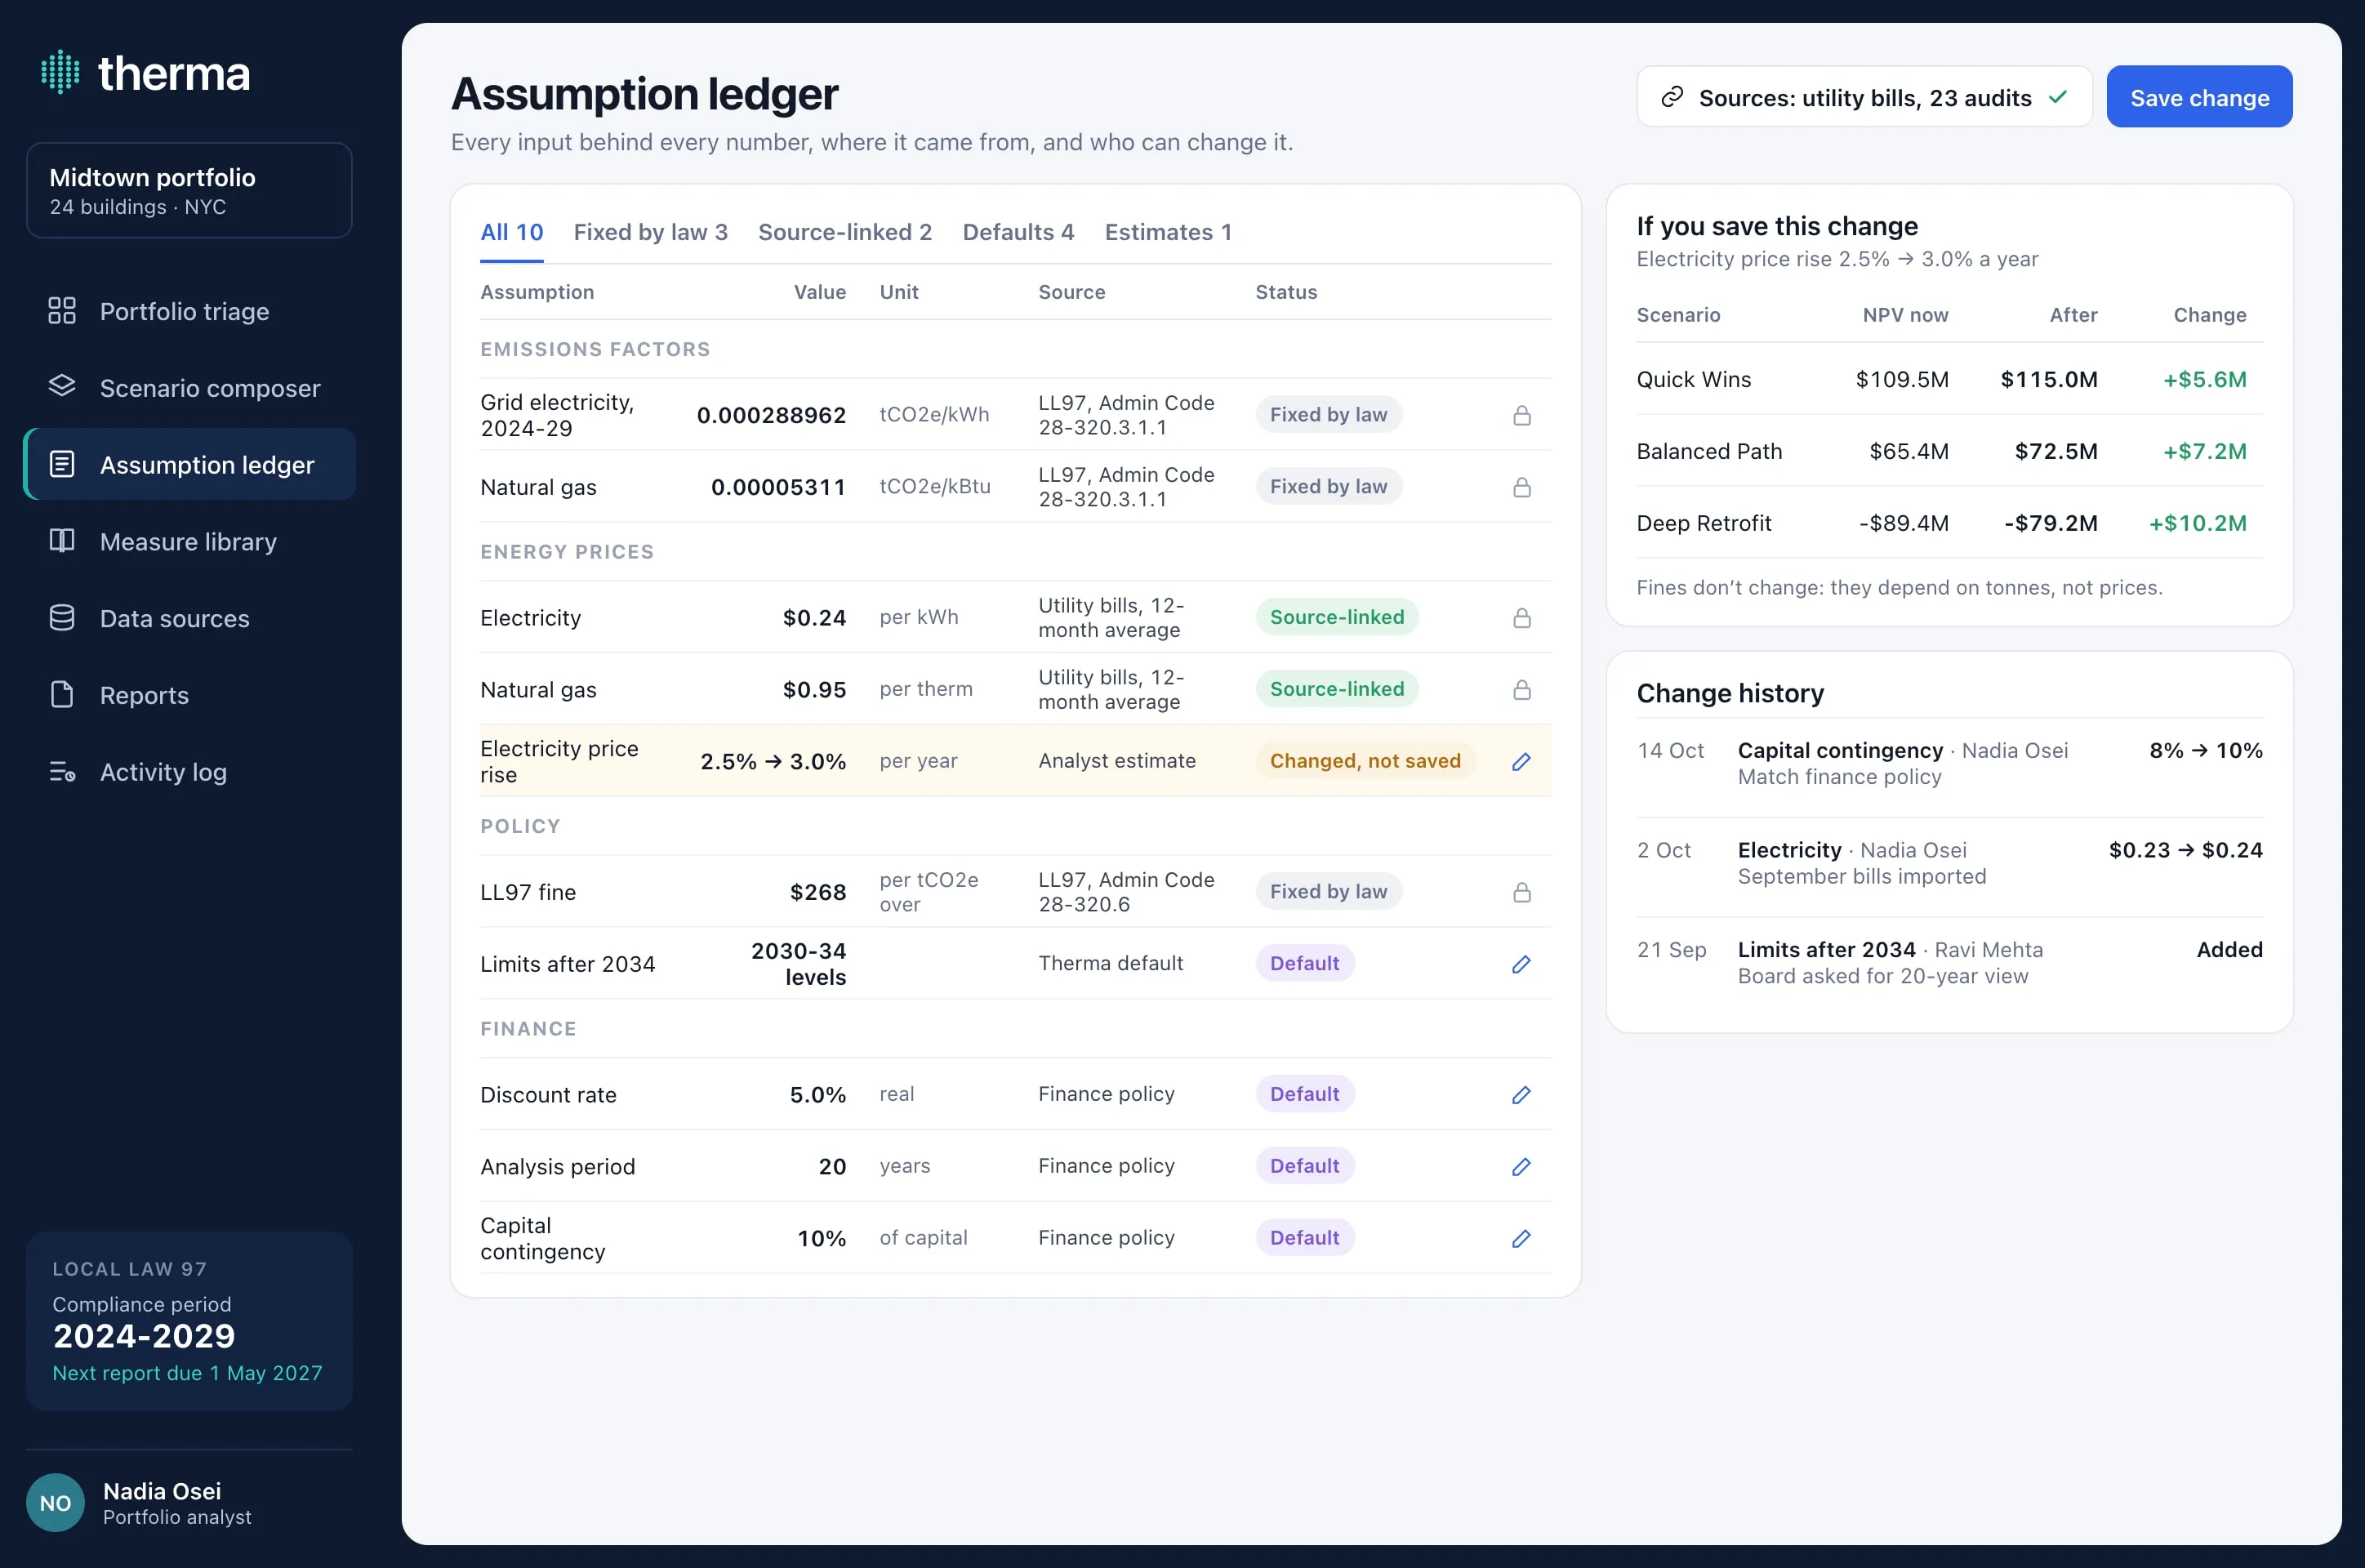
Raise the electricity price rise from 2.5% to 3.0% and see every scenario’s NPV move before saving. Fines stay put: they depend on tonnes, not prices. Compose a plan, see the consequence
What brokeRetrofit options compared in separate reports hide how cost, carbon and fines pull against each other.
What I decidedThe composer switches measures on for one building and adds them up against the budget: capital, tonnes, energy cost, the fine in 2030 and the NPV. The charts show cumulative fines and emissions against both limits, and the screen says plainly when a plan clears 2024 but not 2030.
The trade-offHonest numbers aren’t always welcome. Heat pumps cut the most carbon here and raise the energy bill, because electricity costs more than the gas it replaces, and the screen shows that as a cost.
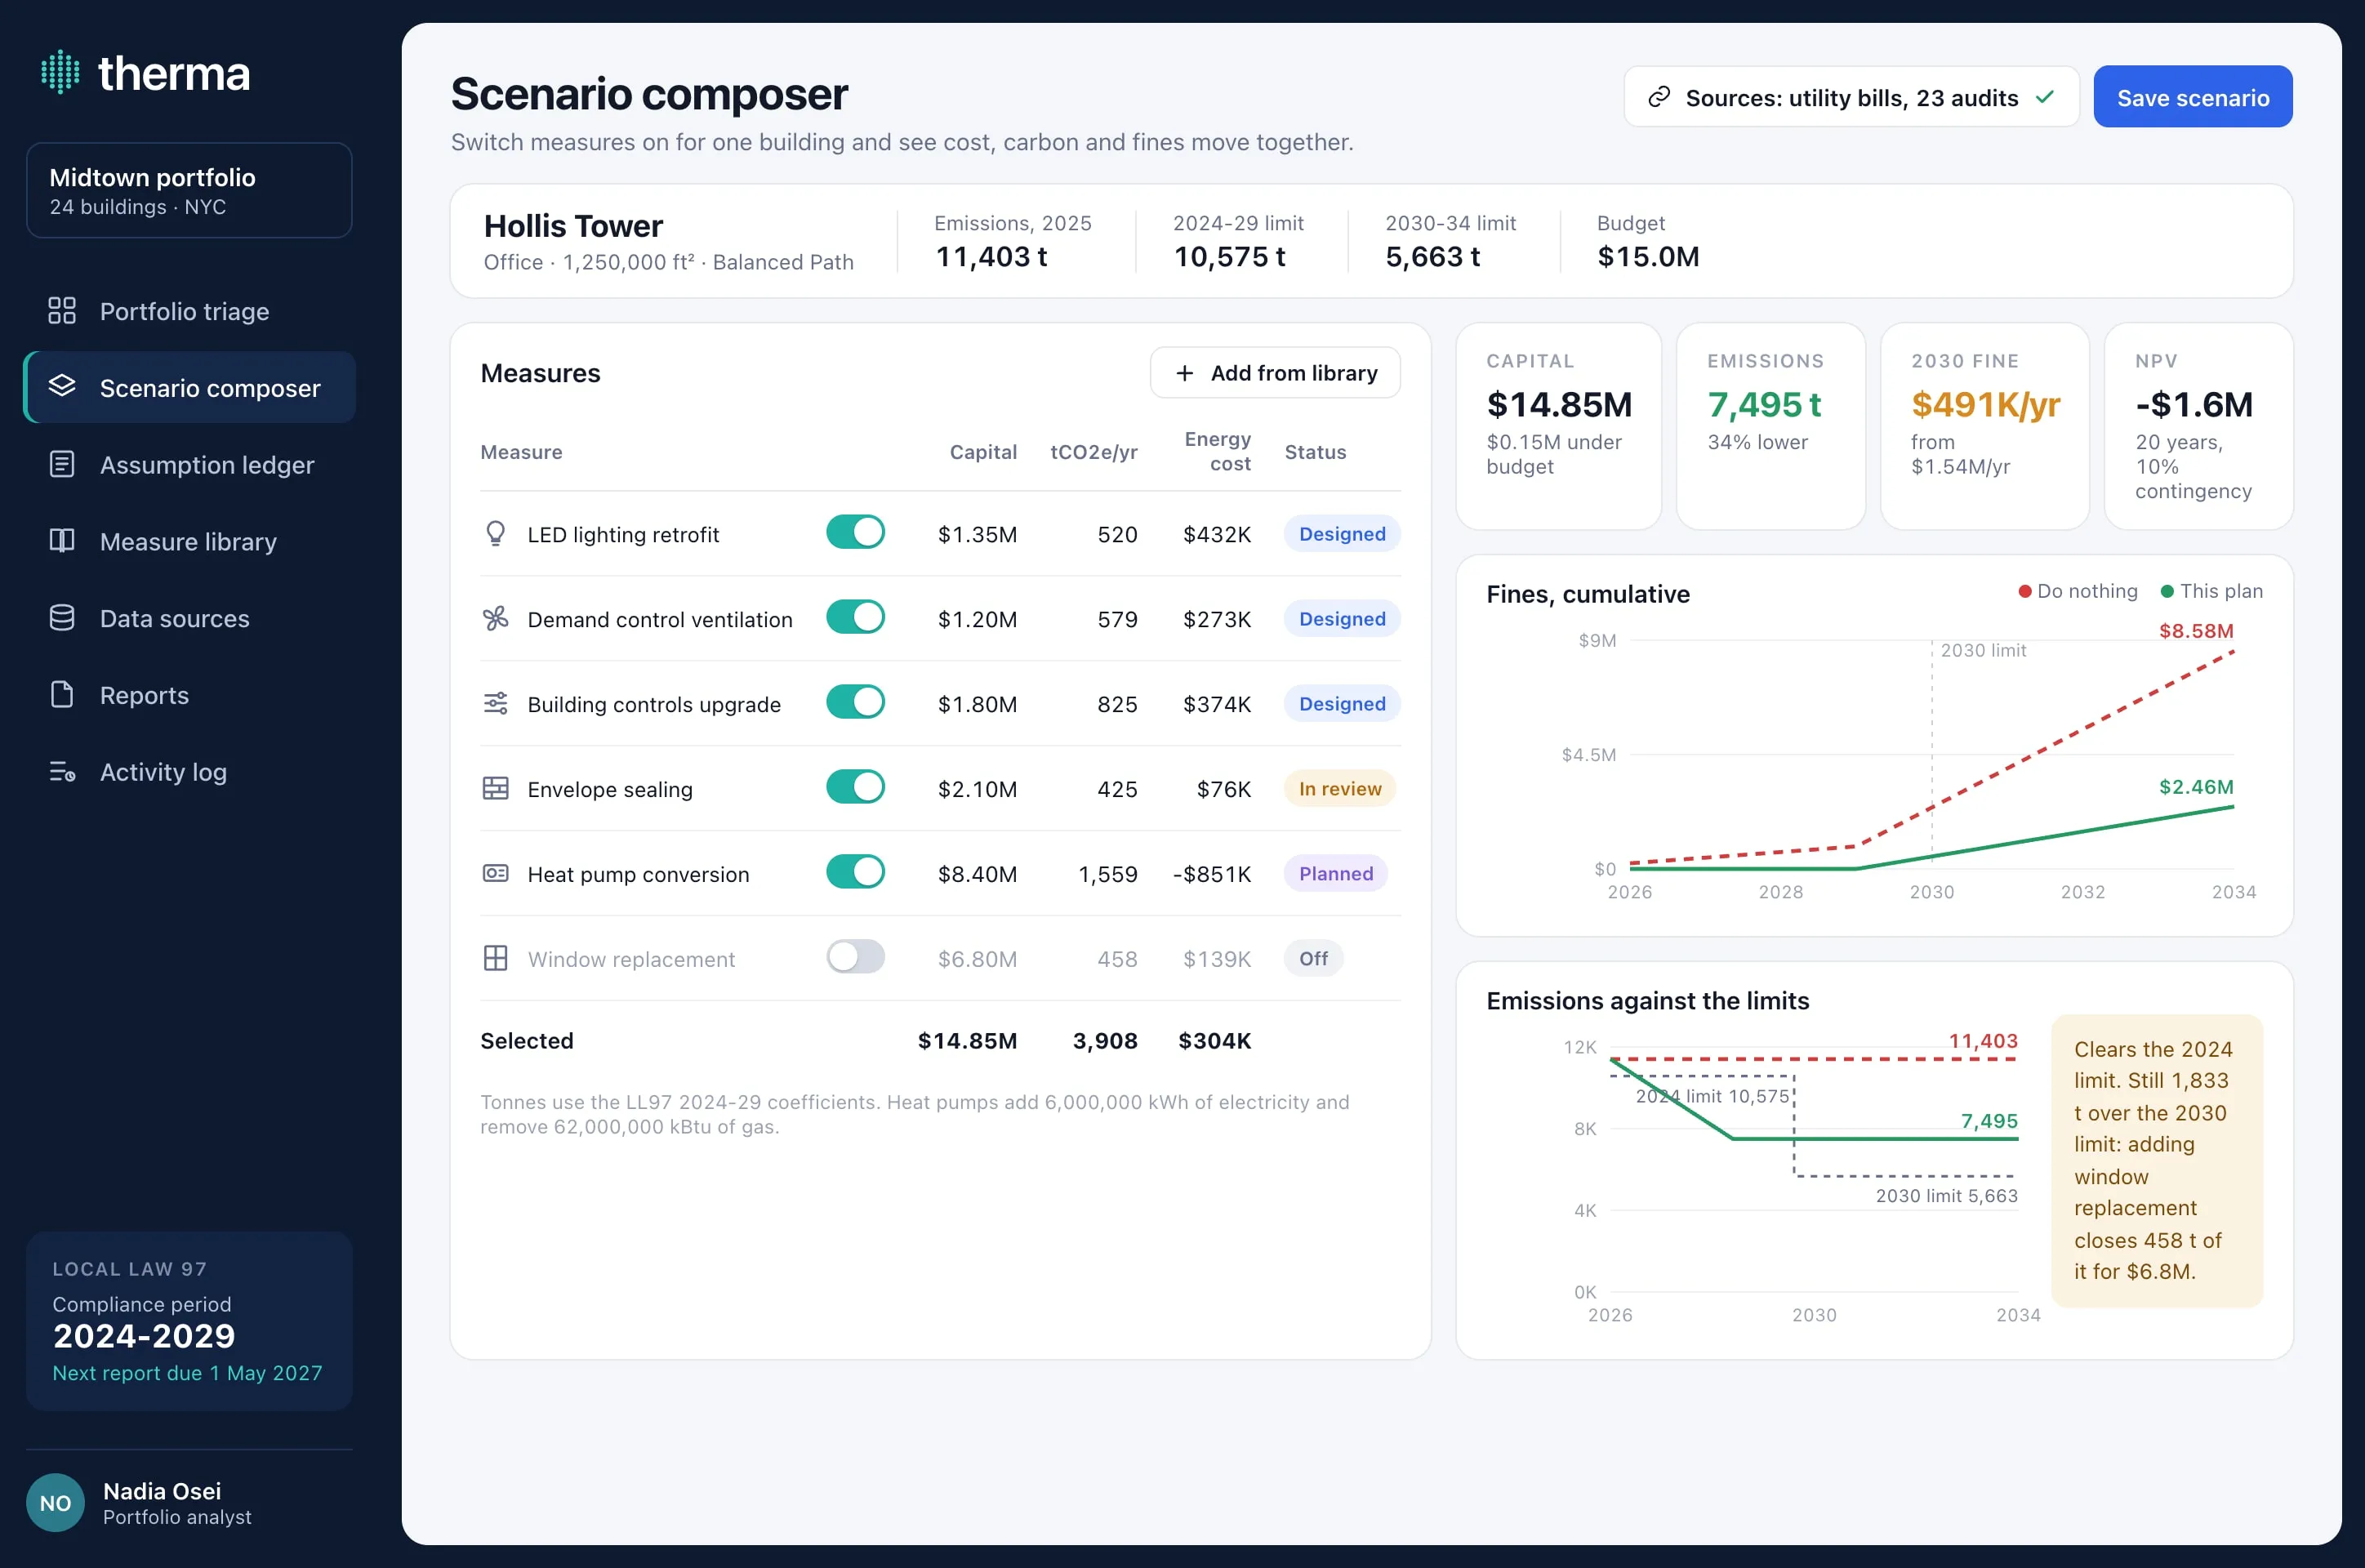
This plan clears the 2024 limit and is still 1,833 t over the 2030 one. The screen names the measure that would close part of the gap. Measures in the same units
What brokeEvery audit prices and scopes a measure its own way, so the same measure can look cheap in one report and costly in the next.
What I decidedThe measure library stores each retrofit measure as a range per square foot and as a share of the building’s emissions, with the audits it came from and how many buildings it fits. The detail shows what it means for one building.
The trade-offRanges compare across buildings and blur each building’s own conditions. The exact figure only appears once the measure is applied in the composer.
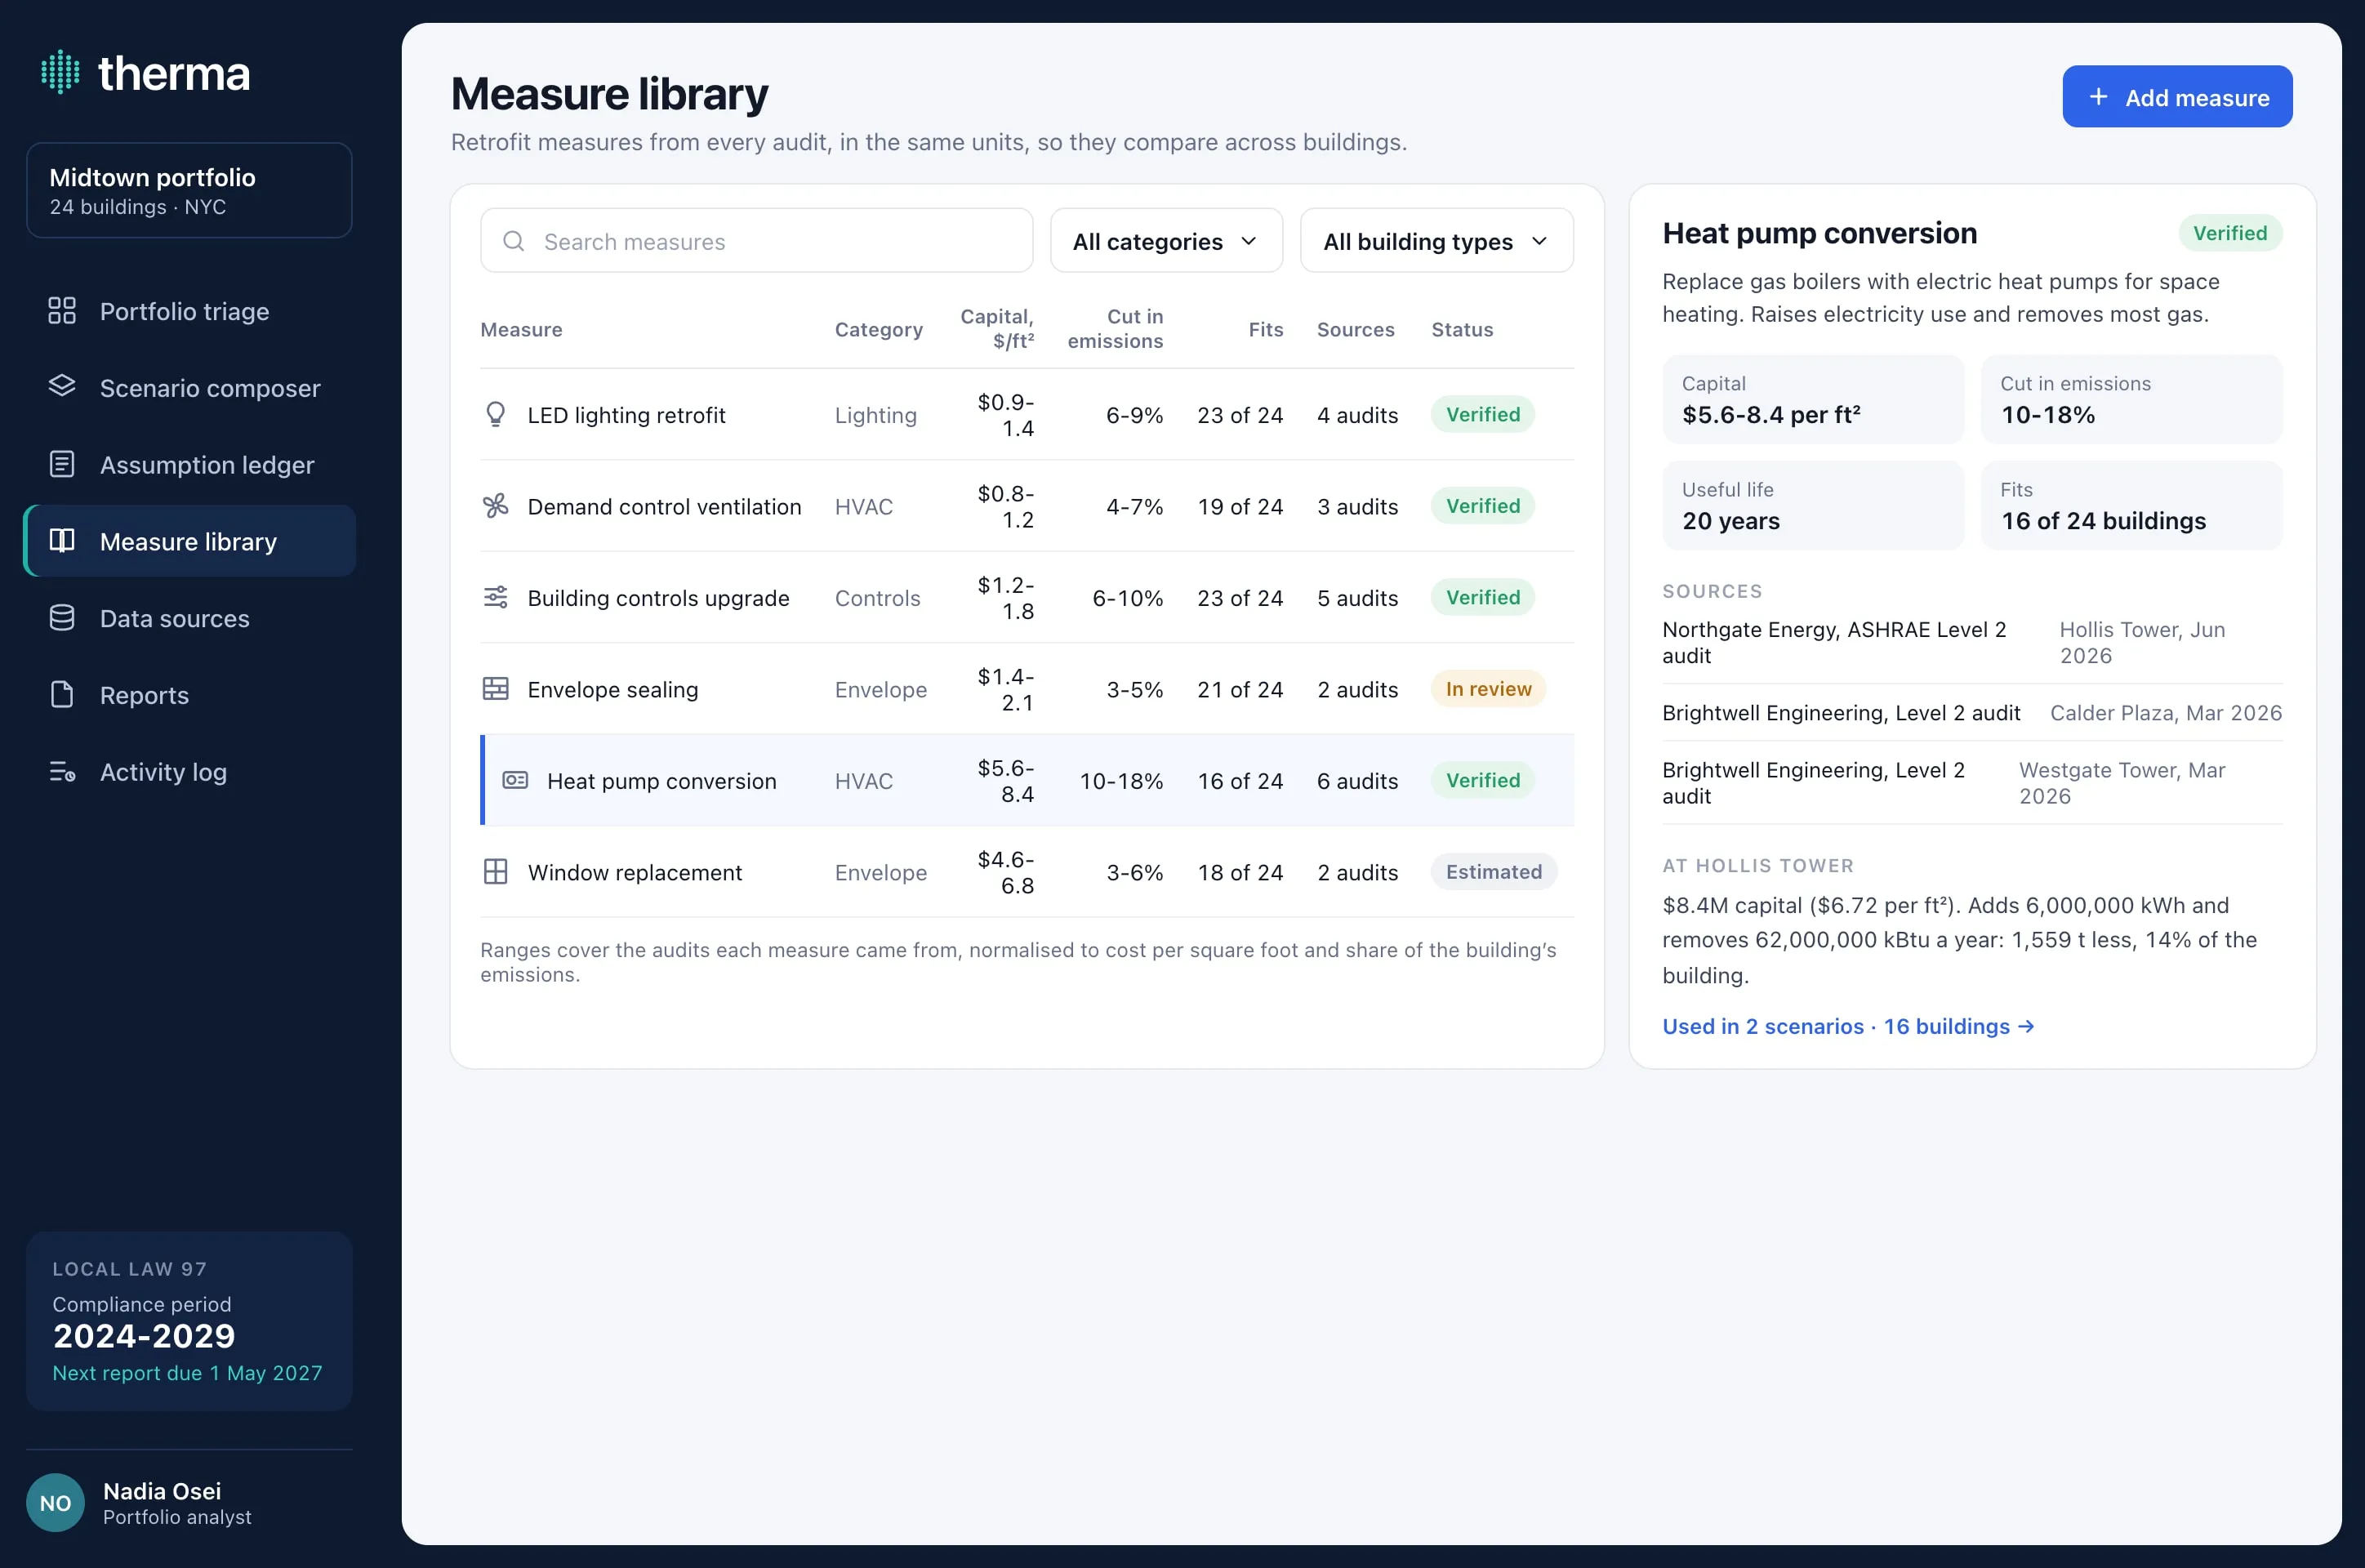
Heat pumps: $5.6 to $8.4 per square foot across six audits, and $8.4M at Hollis Tower.
What I’d test first
Two audits of the same building from two engineering firms, run through the library. If the normalised measures disagree by more than their ranges, the library isn’t doing its job.
Whether a finance team accepts an NPV with avoided fines folded in, or wants fines shown apart from energy savings.
What happens when the law changes. The 2030 coefficients are set by rule, so the locked values need an owner and a date, not just a lock.
My part
I designed Therma on my own, in Figma: the portfolio model, the triage map, the scenario composer, the assumption ledger and the measure library.